Time to Send
Which routes at Rumney are the hardest to flash and which take the longest to send? If you're shopping for the perfect project to break you into the next grade, look no further. Does the answer differ for women? Spoilers: it does, and I can show you how. In this article, I analyze data from 2,500 Mountain Project users to explore which routes at Rumney are quickest to send for the grade.
I, like many of my friends, use Mountain Project to track my progress in climbing. At the end of a crag day, I record whether I flashed, fell/hung, or sent each route. This data alone can already tell rich stories about a climber’s experience. For example, I’ve not gotten Debbie Does CPR clean since sending, because I rely on very specific beta (double toe jams!) that is always hard for me to nail in the first go.
When viewed at scale, ticks tell interesting stories about the average climber’s experience at the crag at whole. Thoughout this article, I analyze the routes at Rumney using two summary statistics of tick data: proportion of users that flash/onsight the route, and number of sessions until sending.
Computing the metrics
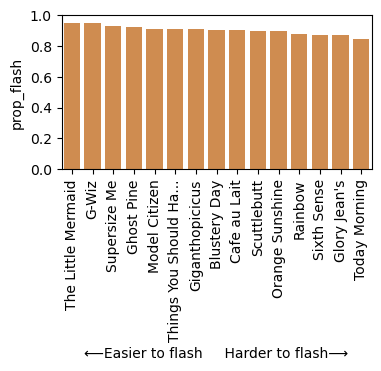
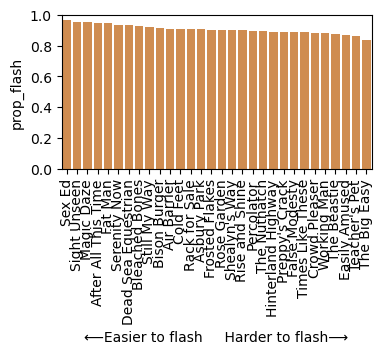
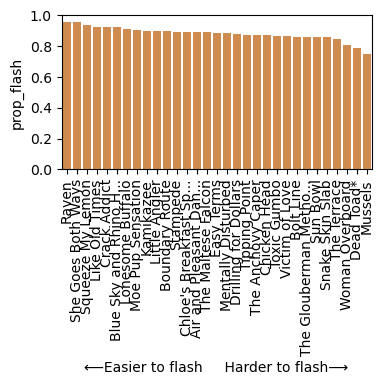
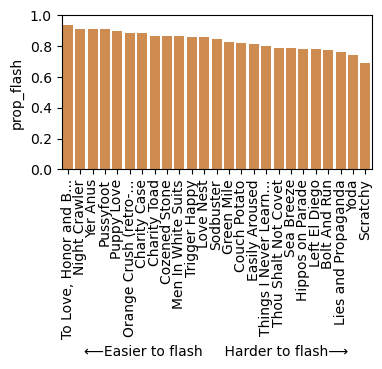
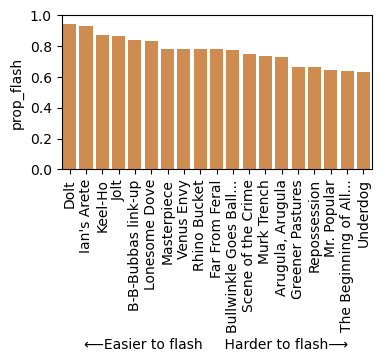
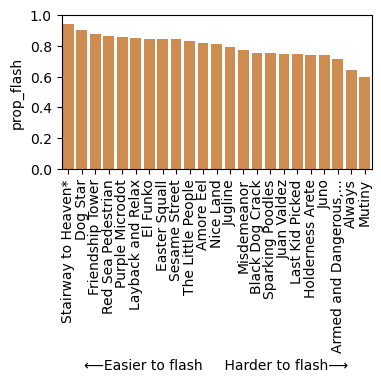
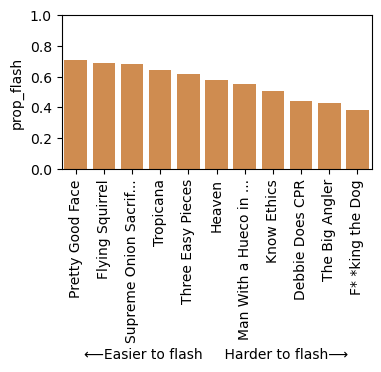
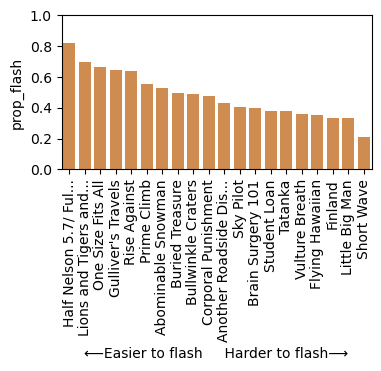
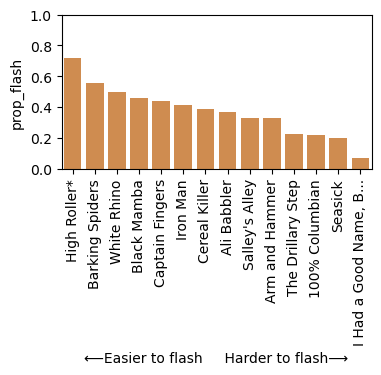
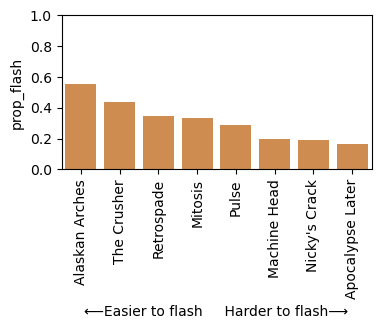
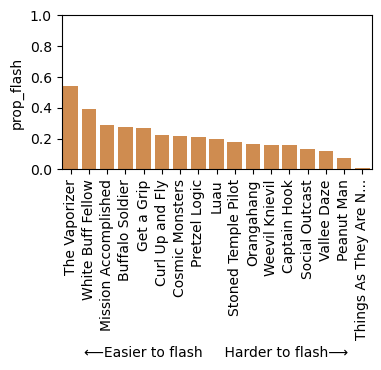
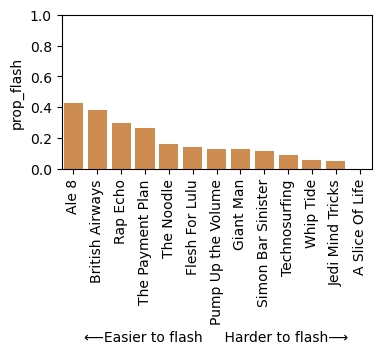
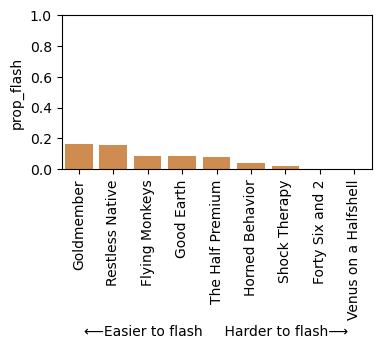
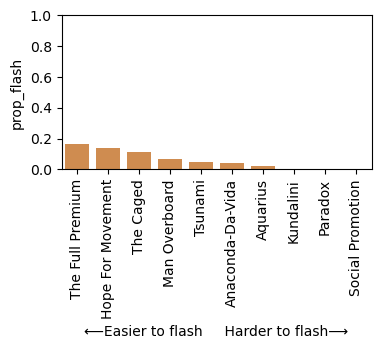
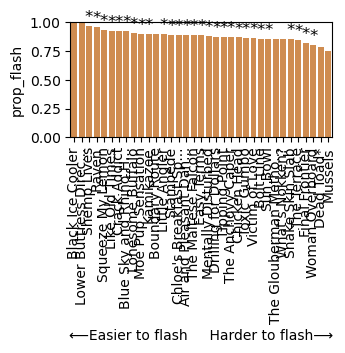
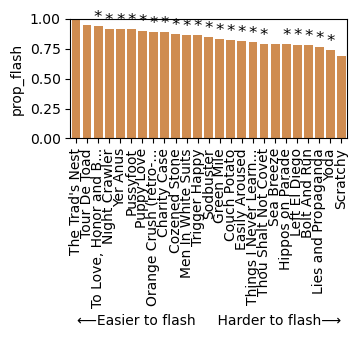
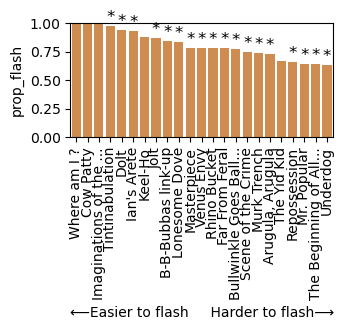
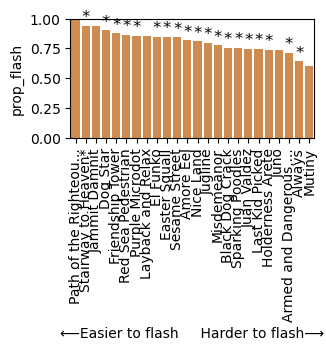
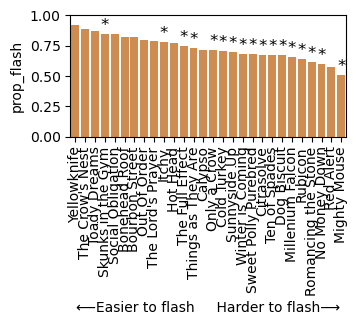
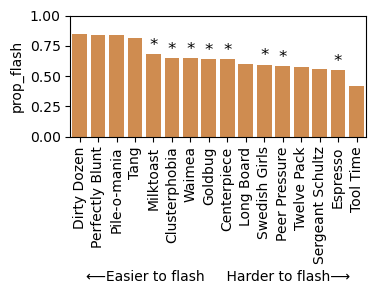
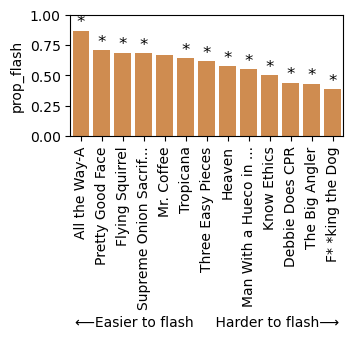
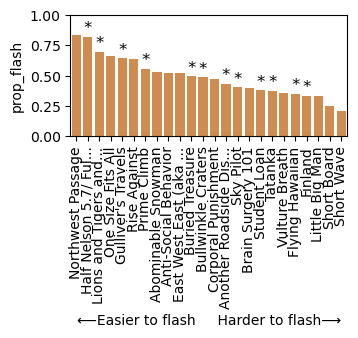
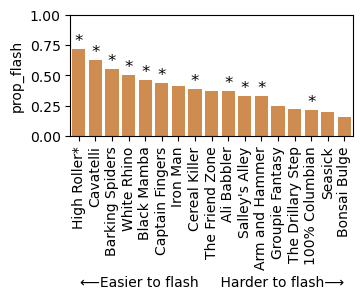
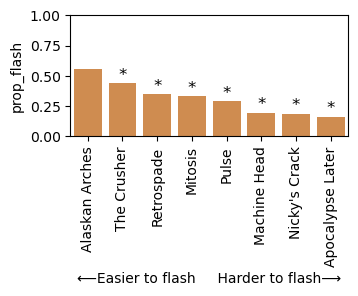
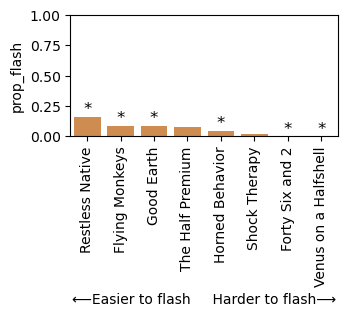
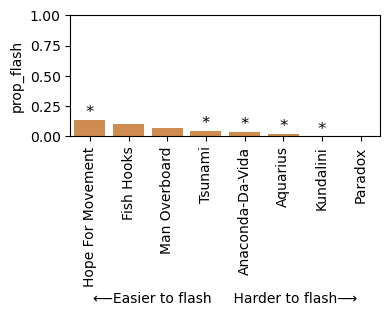
The first metric– proportion of users that flash– gives us insight into which routes are the hardest to get first try, perhaps due to cryptic beta or a hidden, reachy move (cough: Underdog is the least flashed 5. 10a, with only 63% of people who get on it able to flash or onsight. Perhaps due to a certain hidden jug?). For the purpose of this analysis, I don’t differentiate between a flash and onsight.
This metric is straightforwardly computed by dividing the number of users who flashed or onsighted a route, by the total number of users:
\[\mathrm{prop\_flash}(\mathrm{route}) = \frac{N_\mathrm{flash\ route} + N_\mathrm{onsight\ route}}{N_\mathrm{total\ route}}\]The second metric–number of sessions–gives us insight into which routes are the “hardest to project,” because they take users several sessions of working them before sending. This metric is trickier to compute. If the user ticked flash or onsight, then \(\mathrm{num\_sessions}(\mathrm{route}, \mathrm{user}) = 0.\) If the user did not flash or onsight, then I count the number of ticks before the first instance of a send.
For example, if the user’s history of ticks on a route look like [fell/hung, fell/hung, redpoint, fell/hung, redpoint], then \(\mathrm{num\_sessions}(\mathrm{route}, \mathrm{user}) = 3.\) The total number of sessions per route is the average over all users for that route:
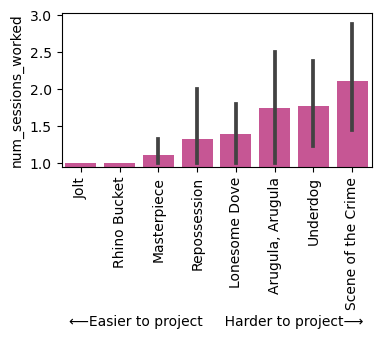
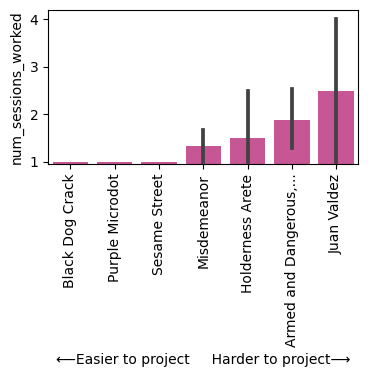
\[\mathrm{num\_sessions}(\mathrm{route}) = \frac{1}{N_\mathrm{users}} \sum\limits_{i=1}^{N_\mathrm{users}} \mathrm{num\_sessions}(\mathrm{route}, \mathrm{user}_i).\]Throughout the analysis, we will consider two versions of this metric. The original, \(\mathrm{num\_sessions(\mathrm{route})}\), includes data from users who flashed or onsighted. The second version, \(\mathrm{num\_sessions\_worked}(\mathrm{route})\), excludes those who got the route first go. The first version’s interpretation is closer to the route’s overall difficulty; of all people who climb it, how long does it take to send? The second version’s interpretation is the route’s projecting difficulty; of the people who choose to come back to climb it, how long does it take to send?
Note that there are several ways in which this metric is lacking. Keep these in mind as you interpret the results:
- I don’t put restrictions on time between attempts. Someone who gets on a route every day for an entire week straight will look the same as someone who gets on a route once a year over five years. While we want to capture the former case, we don’t prevent the latter. As a result, routes may appear artificially more difficult than they are; the person who sends after five sessions over five years may have taken so long simply because they forgot the beta in between.
- People are not always projecting the route. For example, I am rarely projecting 5. 10s these days but have the unfortunate habit of falling on them frequently in my warm ups. Like with the above point, if people get on routes while still warming up, the route may appear artificially more difficult.
- Not everyone uses MP the same way. I track every route that I climb. Some users only record ticks when they send and don’t record the “fell/hung” instances in between. To account for this, I only count it as a flash/onsight if that option was explicitly chosen. Furthermore, if a user’s first tick is a “redpoint” for a given route (not a flash or onsight), then I exclude that tick from the analysis, since it is likely indication that they don’t use MP the way we expect.
Most difficult to flash and send at each grade
Enough math– let’s look at the results! Note: if you are a woman or shorter climber, you may also be interested in the next section, where I show how these results differ by gender.
About the data. This dataset contains the entire tick history for 2,498 users on Mountain Project. I obtained these users by looking at the ~250 most recent ticks from all the classic climbs at Rumney. While the dataset is large, it does not cover the entire climber base at Rumney. I might write a post summarizing some of its statistics in the future.
Not all routes are shown for each grade, because I only visualized those that had at least five users who had climbed them in the data. Because they are somewhat rare, I excluded plus-grades. Email me if you want those, and I’d be happy to share!
Some of the prop_flash values seem abnormally high. For example, 70% of people who hop on Clusterphobia send it first go, which seems a bit high for a 5.10d at an overall moderate wall. We can’t know for sure whether this number is higher than it should be, but it’s possible that the entire dataset is skewed toward stronger climbers. Those who are intense enough to diligently tick MP may be stronger overall than your average climber.
| Grade | Ordered by num_sessions_worked | Ordered by prop_flash |
|---|---|---|
| 5.6 | 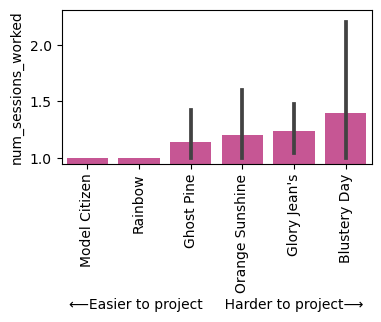 |
 |
| 5.7 | 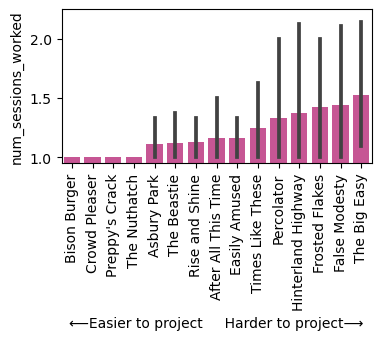 |
 |
| 5.8 | 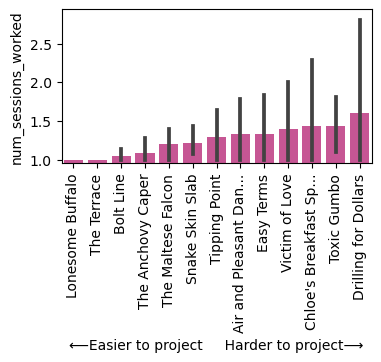 |
 |
| 5.9 | 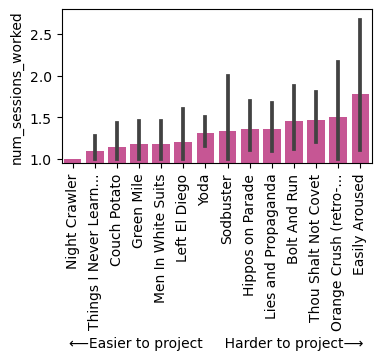 |
 |
| 5.10a | 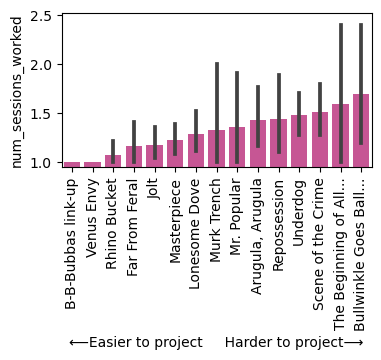 |
 |
| 5.10b | 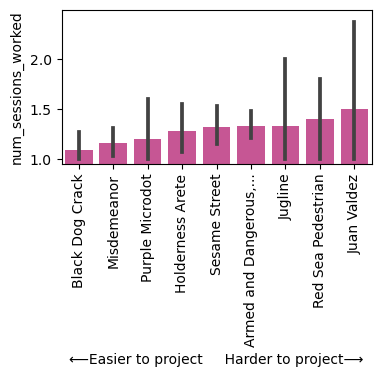 |
 |
| 5.10c | 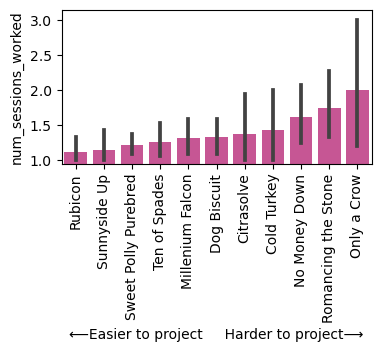 |
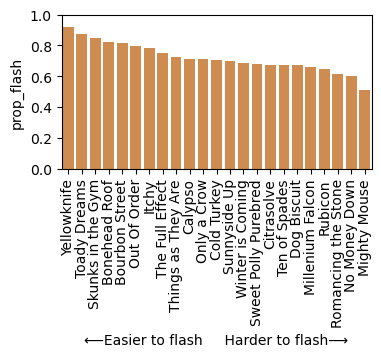 |
| 5.10d | 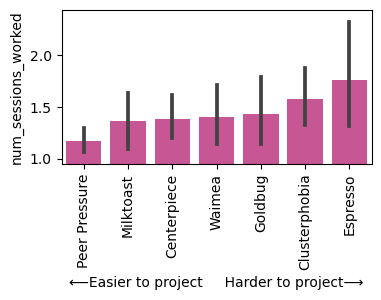 |
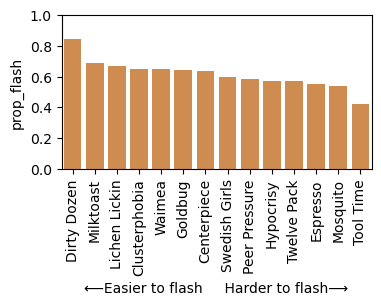 |
| 5.11a | 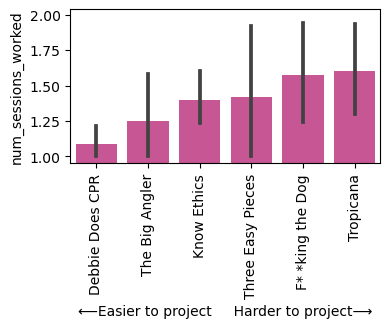 |
 |
| 5.11b | 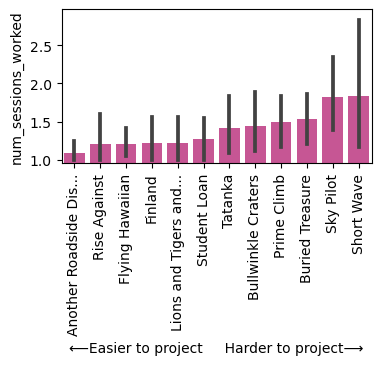 |
 |
| 5.11c | 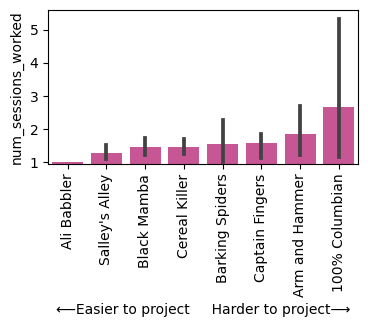 |
 |
| 5.11d | 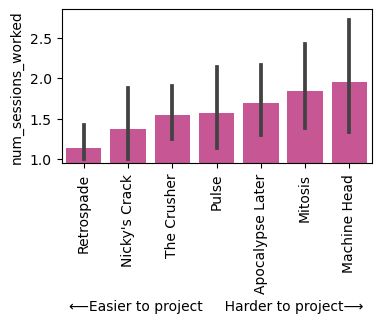 |
 |
| 5.12a | 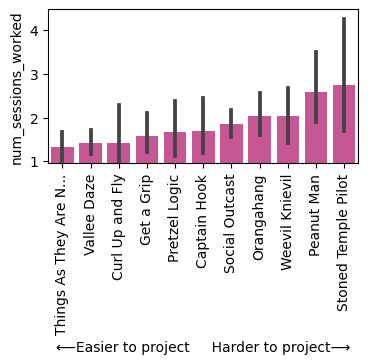 |
 |
| 5.12b | 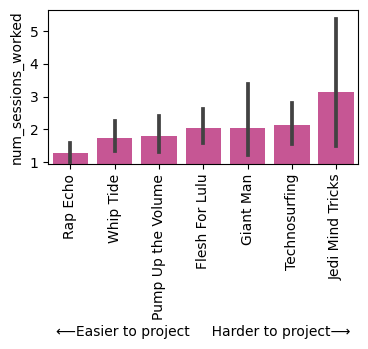 |
 |
| 5.12c | 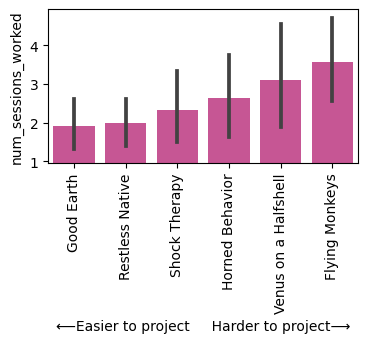 |
 |
| 5.12d | 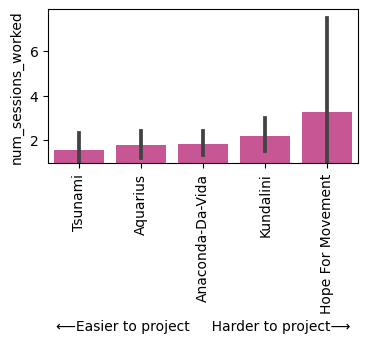 |
 |
Gender differences in time to send
Since our metrics proxy the difficulty of a climb, a natural question to ask is whether the above trends change when we separately consider gender. To answer this question, we will user MP’s self-reported gender categories.
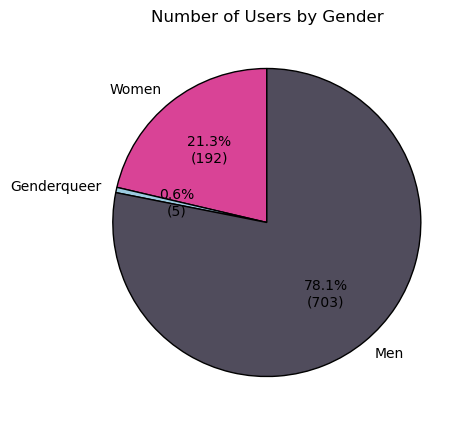
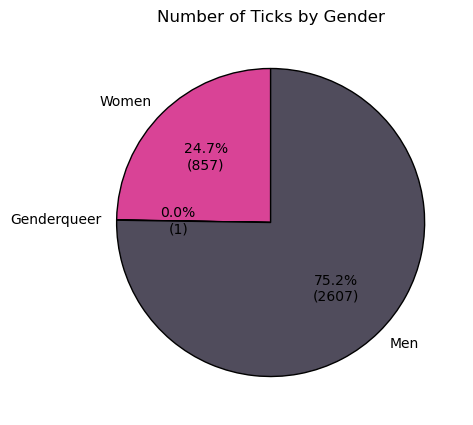
Before we dive in, a disclaimer: while the full dataset has 2,498 unique users, only 900 have their gender listed in their profile. Perhaps true to real life, the gender distribution is imbalanced; men make up about 75% of the total users and ticks. Unfortunately, there is so little data available for the genderqueer category (only one tick!) that it made sense to exclude from the analysis.
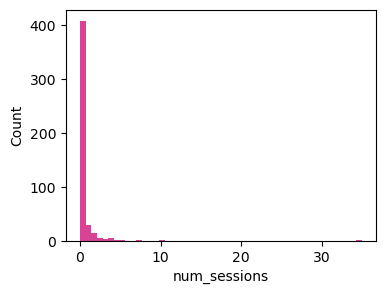
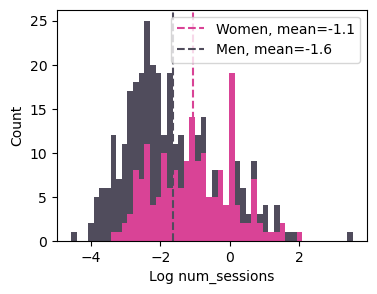
Below, I plot the histogram of our num_sessions metric across all routes. The distribution has a very heavy tail, meaning that our metric manifested lower values near zero for the most part, but there were some exceptional routes that took users, on average, much longer to send. For example, that tiny blip of a route at ~30 sessions is actually from one user who provided 35 separate ticks on Cold War, 5. 14a.
To allow ourselves to interpret the spread of difficulties much easier, I took the log of the num_sessions metric (plotted on the right).
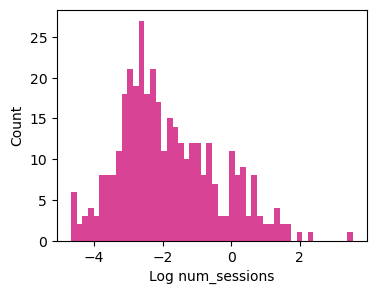
Remarkably, when we color code the plot by gender, we see that it splits into two very distinct distributions! The average number of sessions to send for men is lower than women by about 0.6 sessions, which means women require almost one full additional attempt.
This pattern– women requiring more attempts on the same route– holds across all grades. Below, each point is a different route. Pink points show the num_sessions for women, and black points show the num_sessions for men. There are plenty of times that I’ve struggled more on a route than my taller male counterparts, a common experience that is neat to see replicated in the data.
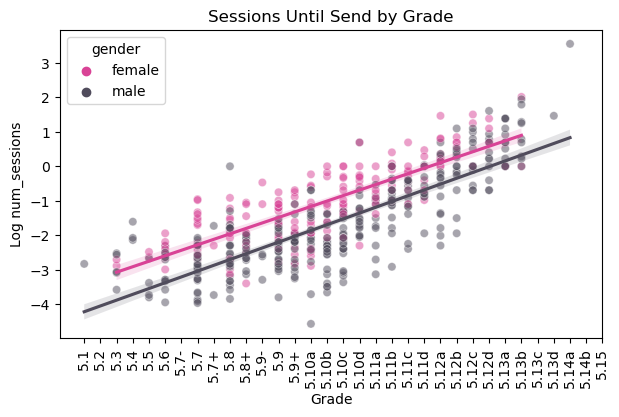
It’s clear that a gender gap exists in the length of time it takes to send a route across all grades. Is that fair and desirable to us as a climbing community? There’s lots of interesting discussion surrounding the role of grades in climbing (see @kimbroughclimbs on Instagram), and how we might advocate for different systems of grading– such as ranges– to make grades more accurate for different body types. Gender is correlated with height, so it is fair to assume that a large part of this gap is in fact due to differences in height manifesting in differences num_sessions.
Is height alone enough to explain why this gap exists? Unlikely, as there here are several reasons a route might still take longer for women to send, even if we were to correct for differences in body size via grades. For example, my stoke and willingness to try hard goes up so much more when I see another woman do well on a route. Same with sharing actionable beta. Both of the above factors definitely impact the amount of time that I spend in figuring a route out. If we were to intervene by changing the grading system, this might lessen gender differences between max grade, but not in time until send. This is just to say that both “grade” and “num sessions” are different ways to capture how “difficult” a climb is, and closing the gap in one may not close the gap in the other.
Which climbs at Rumney do women send quicker?
The next set of plots show the differences in our two metrics between men and women. Specifically, the difference in number of sessions is:
\[\mathrm{num\_sessions}(\mathrm{route} | \mathrm{user} = woman) - \mathrm{num\_sessions}(\mathrm{route} | \mathrm{user} = man).\]When the above quantity is negative, that means women send quicker.
Likewise, the difference in probability of flashing is:
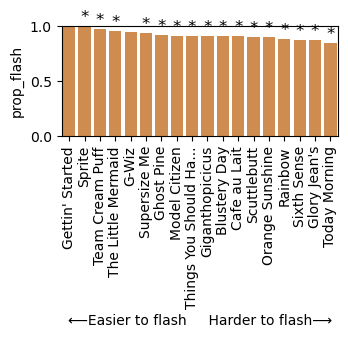
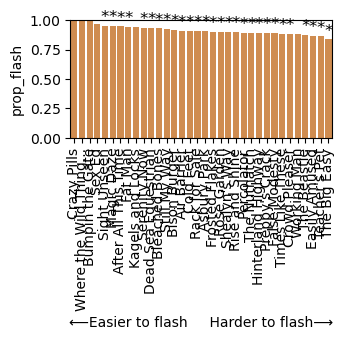
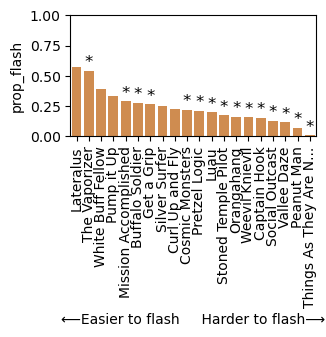
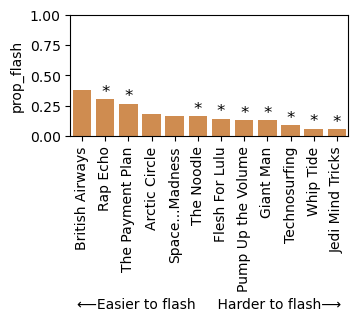
\[\mathrm{prop\_flash}(\mathrm{route} | \mathrm{user} = woman) - \mathrm{prop\_flash}(\mathrm{route} | \mathrm{user} = man).\]When the above quantity is positive, that means a higher proportion of women flash the route than men. If either of the quantities are near “0,” that means it’s equal for men and women. Below, I order the plots so that the relatively more approachable routes for women are on the left.
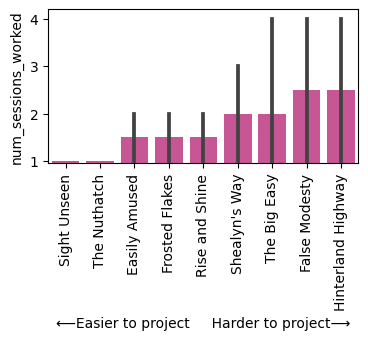
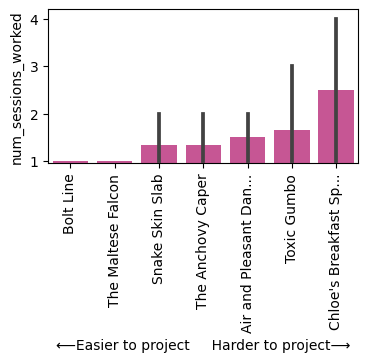
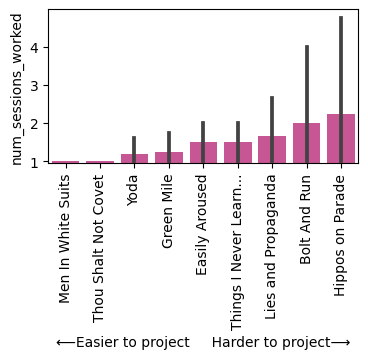
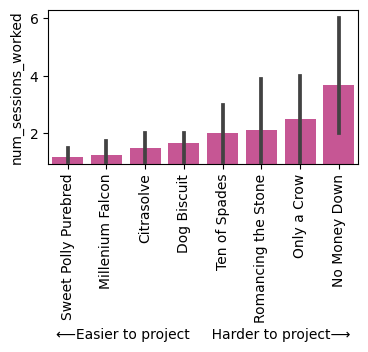
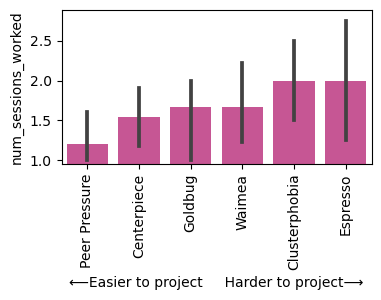
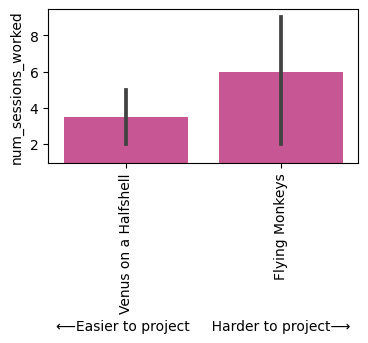
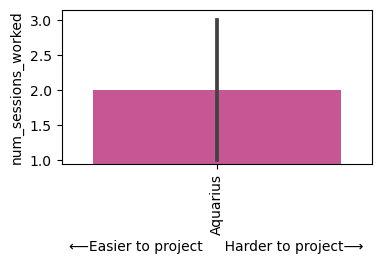
Sadly, when we break down a specific route’s ticks by gender, there are very few instances of women that remain, especially as the grades become harder and fewer people climb the routes overall. I put a “*” to denote routes where there were at least three woman users. Basically, interpret the star-less bars with more caution. Routes that had no ticks from women in my dataset are not plotted.
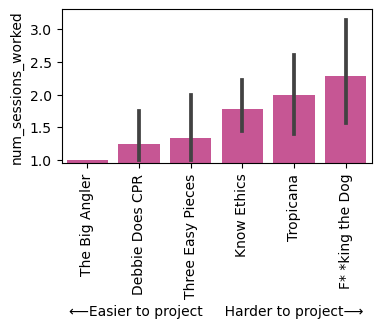
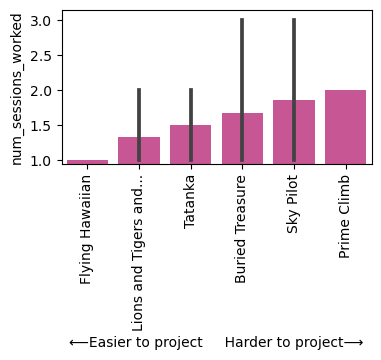
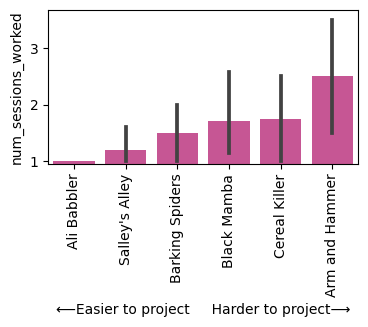
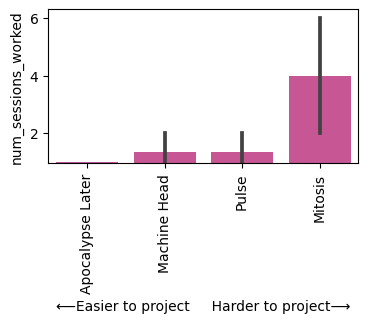
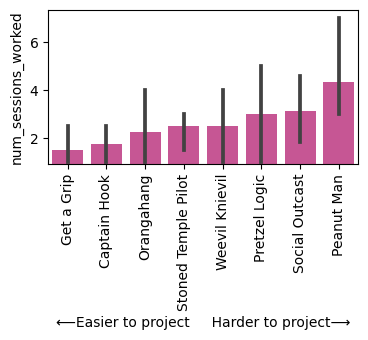
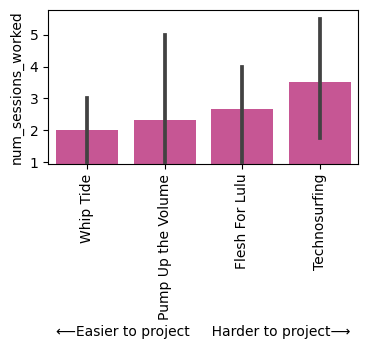
When interpreting the plots below, keep in mind the difference between the relative ease and absolute ease of a route. Knowing which routes are quicker for women to send then men doesn’t necessarily mean that the route is quick to send in general. For example, looking at the num_sessions_worked plots for 5.9’s, we can see that Easily Aroused is relatively quicker for women to send (left column). However, if we look at the corresponding plot of absolute difficulty, Easily Aroused still takes longer to send than Yoda, which is also slightly favors women and is easier overall. Routes sorted by num_sessions
| Grade | Relative num_sessions_worked for women | Absolute num_sessions_worked for women |
|---|---|---|
| 5.7 | 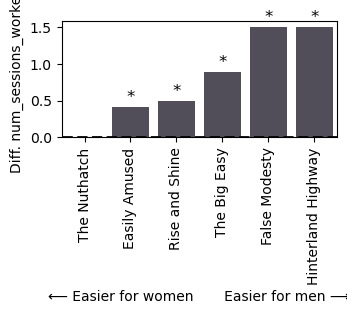 |
 |
| 5.8 | 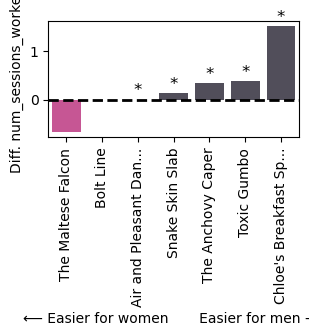 |
 |
| 5.9 | 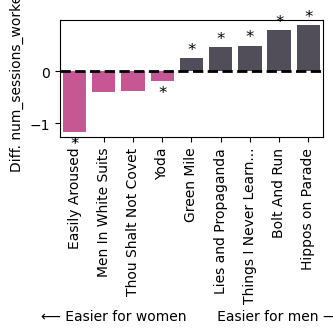 |
 |
| 5.10a | 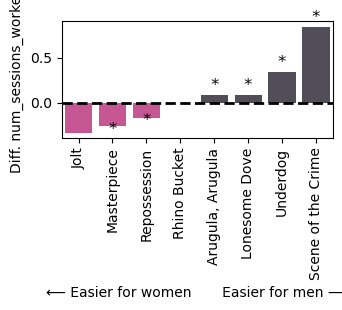 |
 |
| 5.10b | 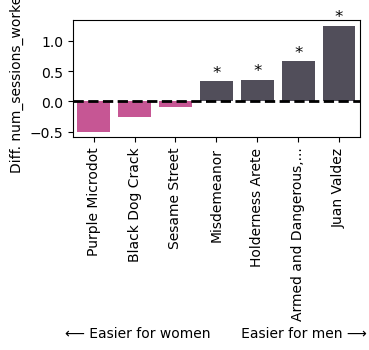 |
 |
| 5.10c | 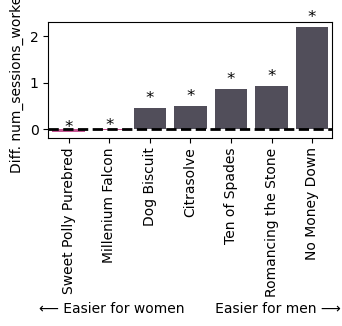 |
 |
| 5.10d | 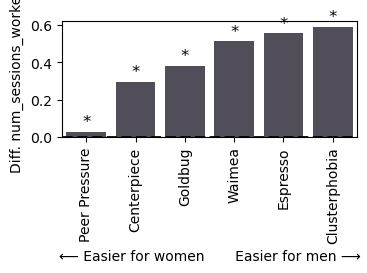 |
 |
| 5.11a | 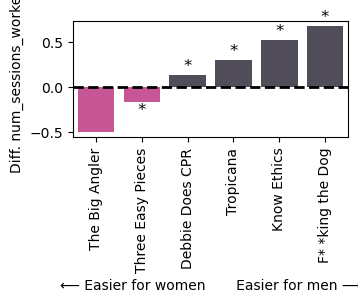 |
 |
| 5.11b | 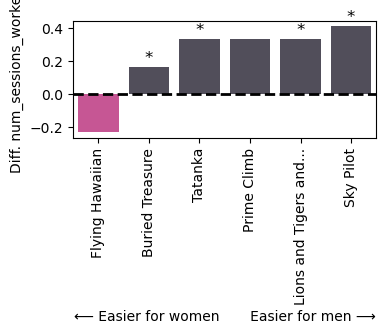 |
 |
| 5.11c | 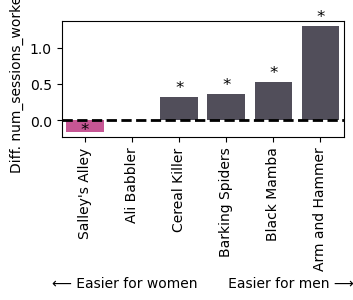 |
 |
| 5.11d | 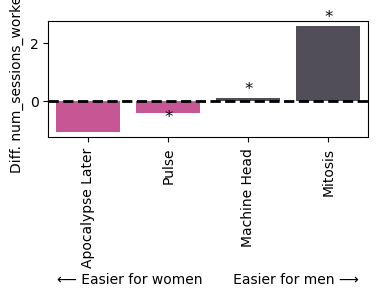 |
 |
| 5.12a | 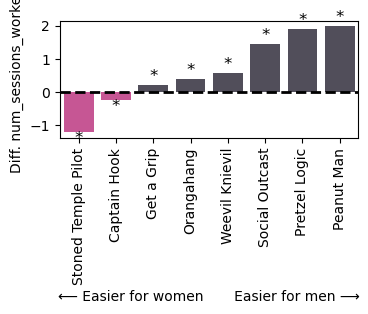 |
 |
| 5.12b | 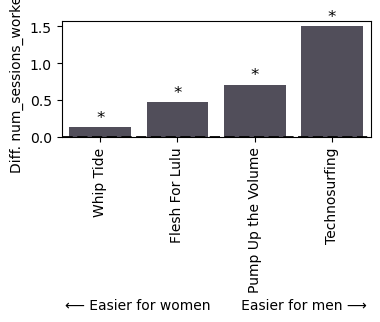 |
 |
| 5.12c | 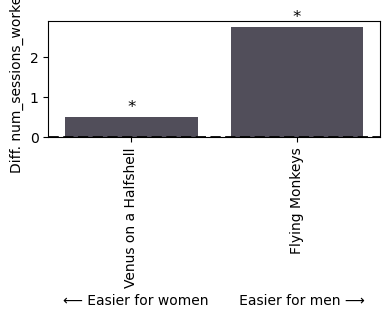 |
 |
| 5.12d | 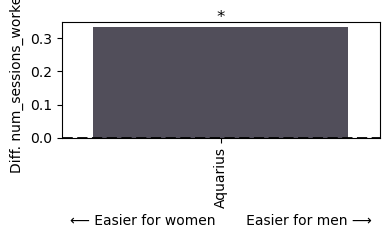 |
 |
Routes sorted by prop_flash
| Grade | Absolute prop_flash for women | Relative prop_flash for women |
|---|---|---|
| 5.6 | 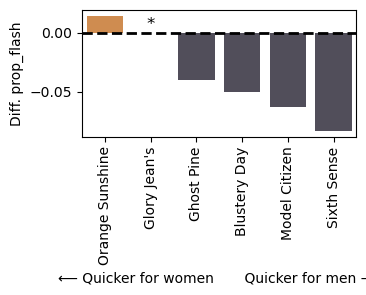 |
 |
| 5.7 | 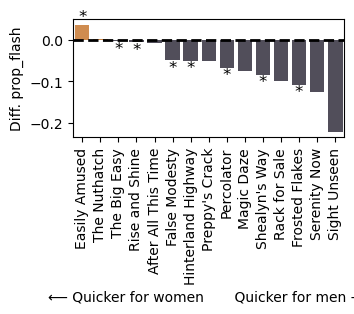 |
 |
| 5.8 | 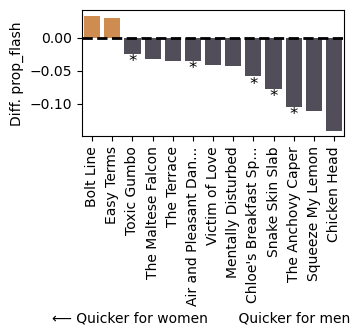 |
 |
| 5.9 | 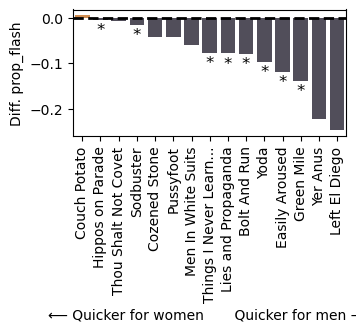 |
 |
| 5.10a | 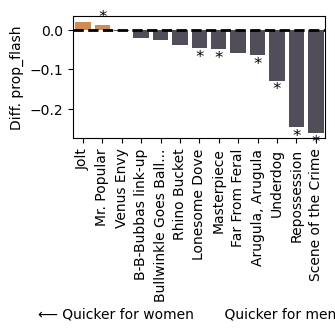 |
 |
| 5.10b | 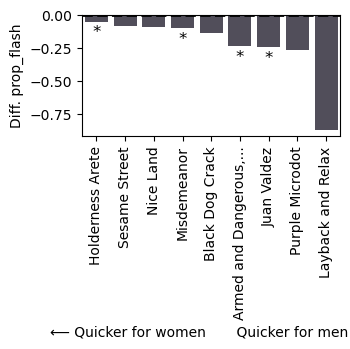 |
 |
| 5.10c | 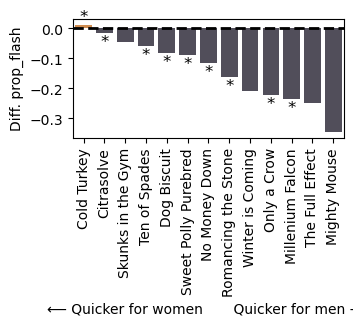 |
 |
| 5.10d | 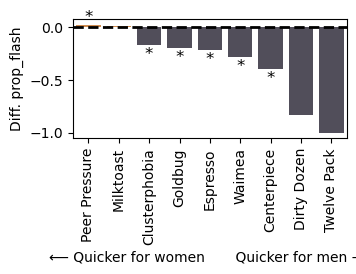 |
 |
| 5.11a | 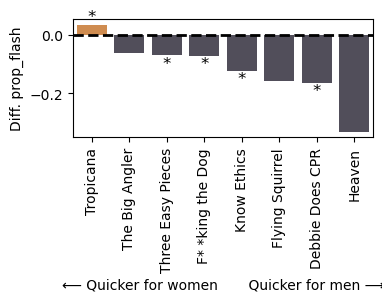 |
 |
| 5.11b | 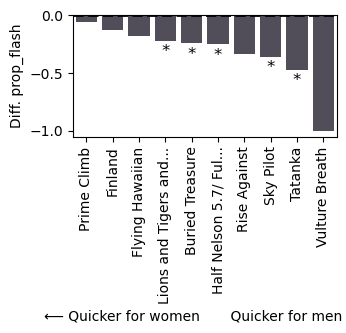 |
 |
| 5.11c | 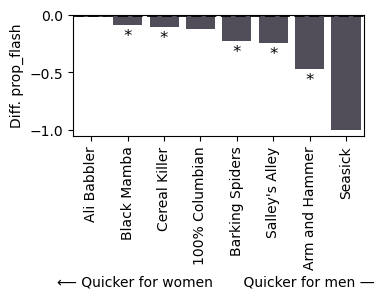 |
 |
| 5.11d | 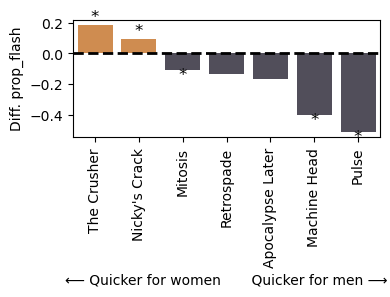 |
 |
| 5.12a | 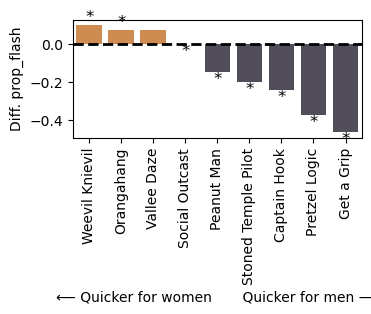 |
 |
| 5.12b | 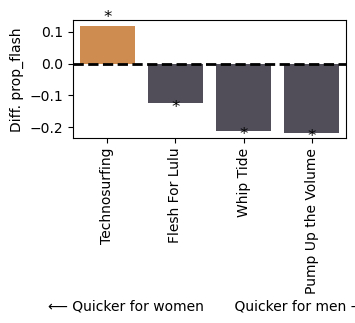 |
 |
| 5.12c | 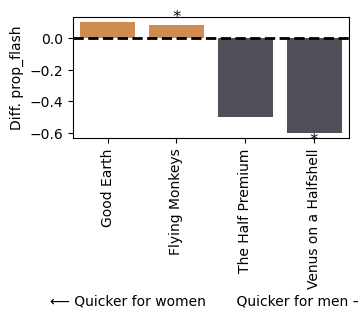 |
 |
| 5.12d | 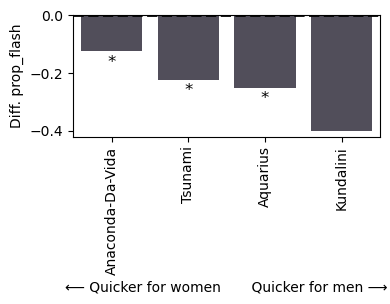 |
 |
Acknowledgements
- Thanks Nowell for your attention to detail and the discussion about how high the prop_flash is, and whether the dataset is biased toward stronger climbers
- Thanks to my beta readers, Nowell, Noreen, Logan, Tammy, Angie, Isaac, Walter, and Jill for the feedback and hype!